


Problem: Lack of data on the design community in Toronto and Ontario. Visualizing data for the industry professional.
This website design features a side-scrolling sprawl of a series of info-graphics revealing trends in the design climate of Toronto (at the time of 2017) for the purposes of providing new creative graduates with data comparing design disciplines, job titles, with other cities in Canada, along with other stats to help inform their next steps.
Web clip
What began as a curiosity fuelled this student-just for-fun project where I played detective to visualize various data in a to-scale side scrolling gimmick to match Toronto neighbourhoods from West to East.
I began with some preliminary research on companies, organizations, firms, boutique studios in Toronto that I knew were practicing and mapped them out along a Toronto Map.
I played with the architecture of the information and ended up with way more data than I bargained for. I couldn't wait to share it, so my project expanded from a few infographics into a series
As my list grew, I dabbled with ways to classify my information, and continued to conduct direct research and find existing documentation on design facts and vocational stats
I made more connections and devised a way to create a narrative with the information. A challenge that I had was how to structure the large amounts of research and data I gathered directly and indirectly. The more I found, the larger the visual system had to be as I wanted to share it.
I tested out ways to visualize the information in a way that would allow the viewer to draw conclusions on their own or make interesting connections at the intersections of data.
The art style and illustration choices used chalk-like strokes and a limited but fun palette. I really wanted to make a story of sorts.
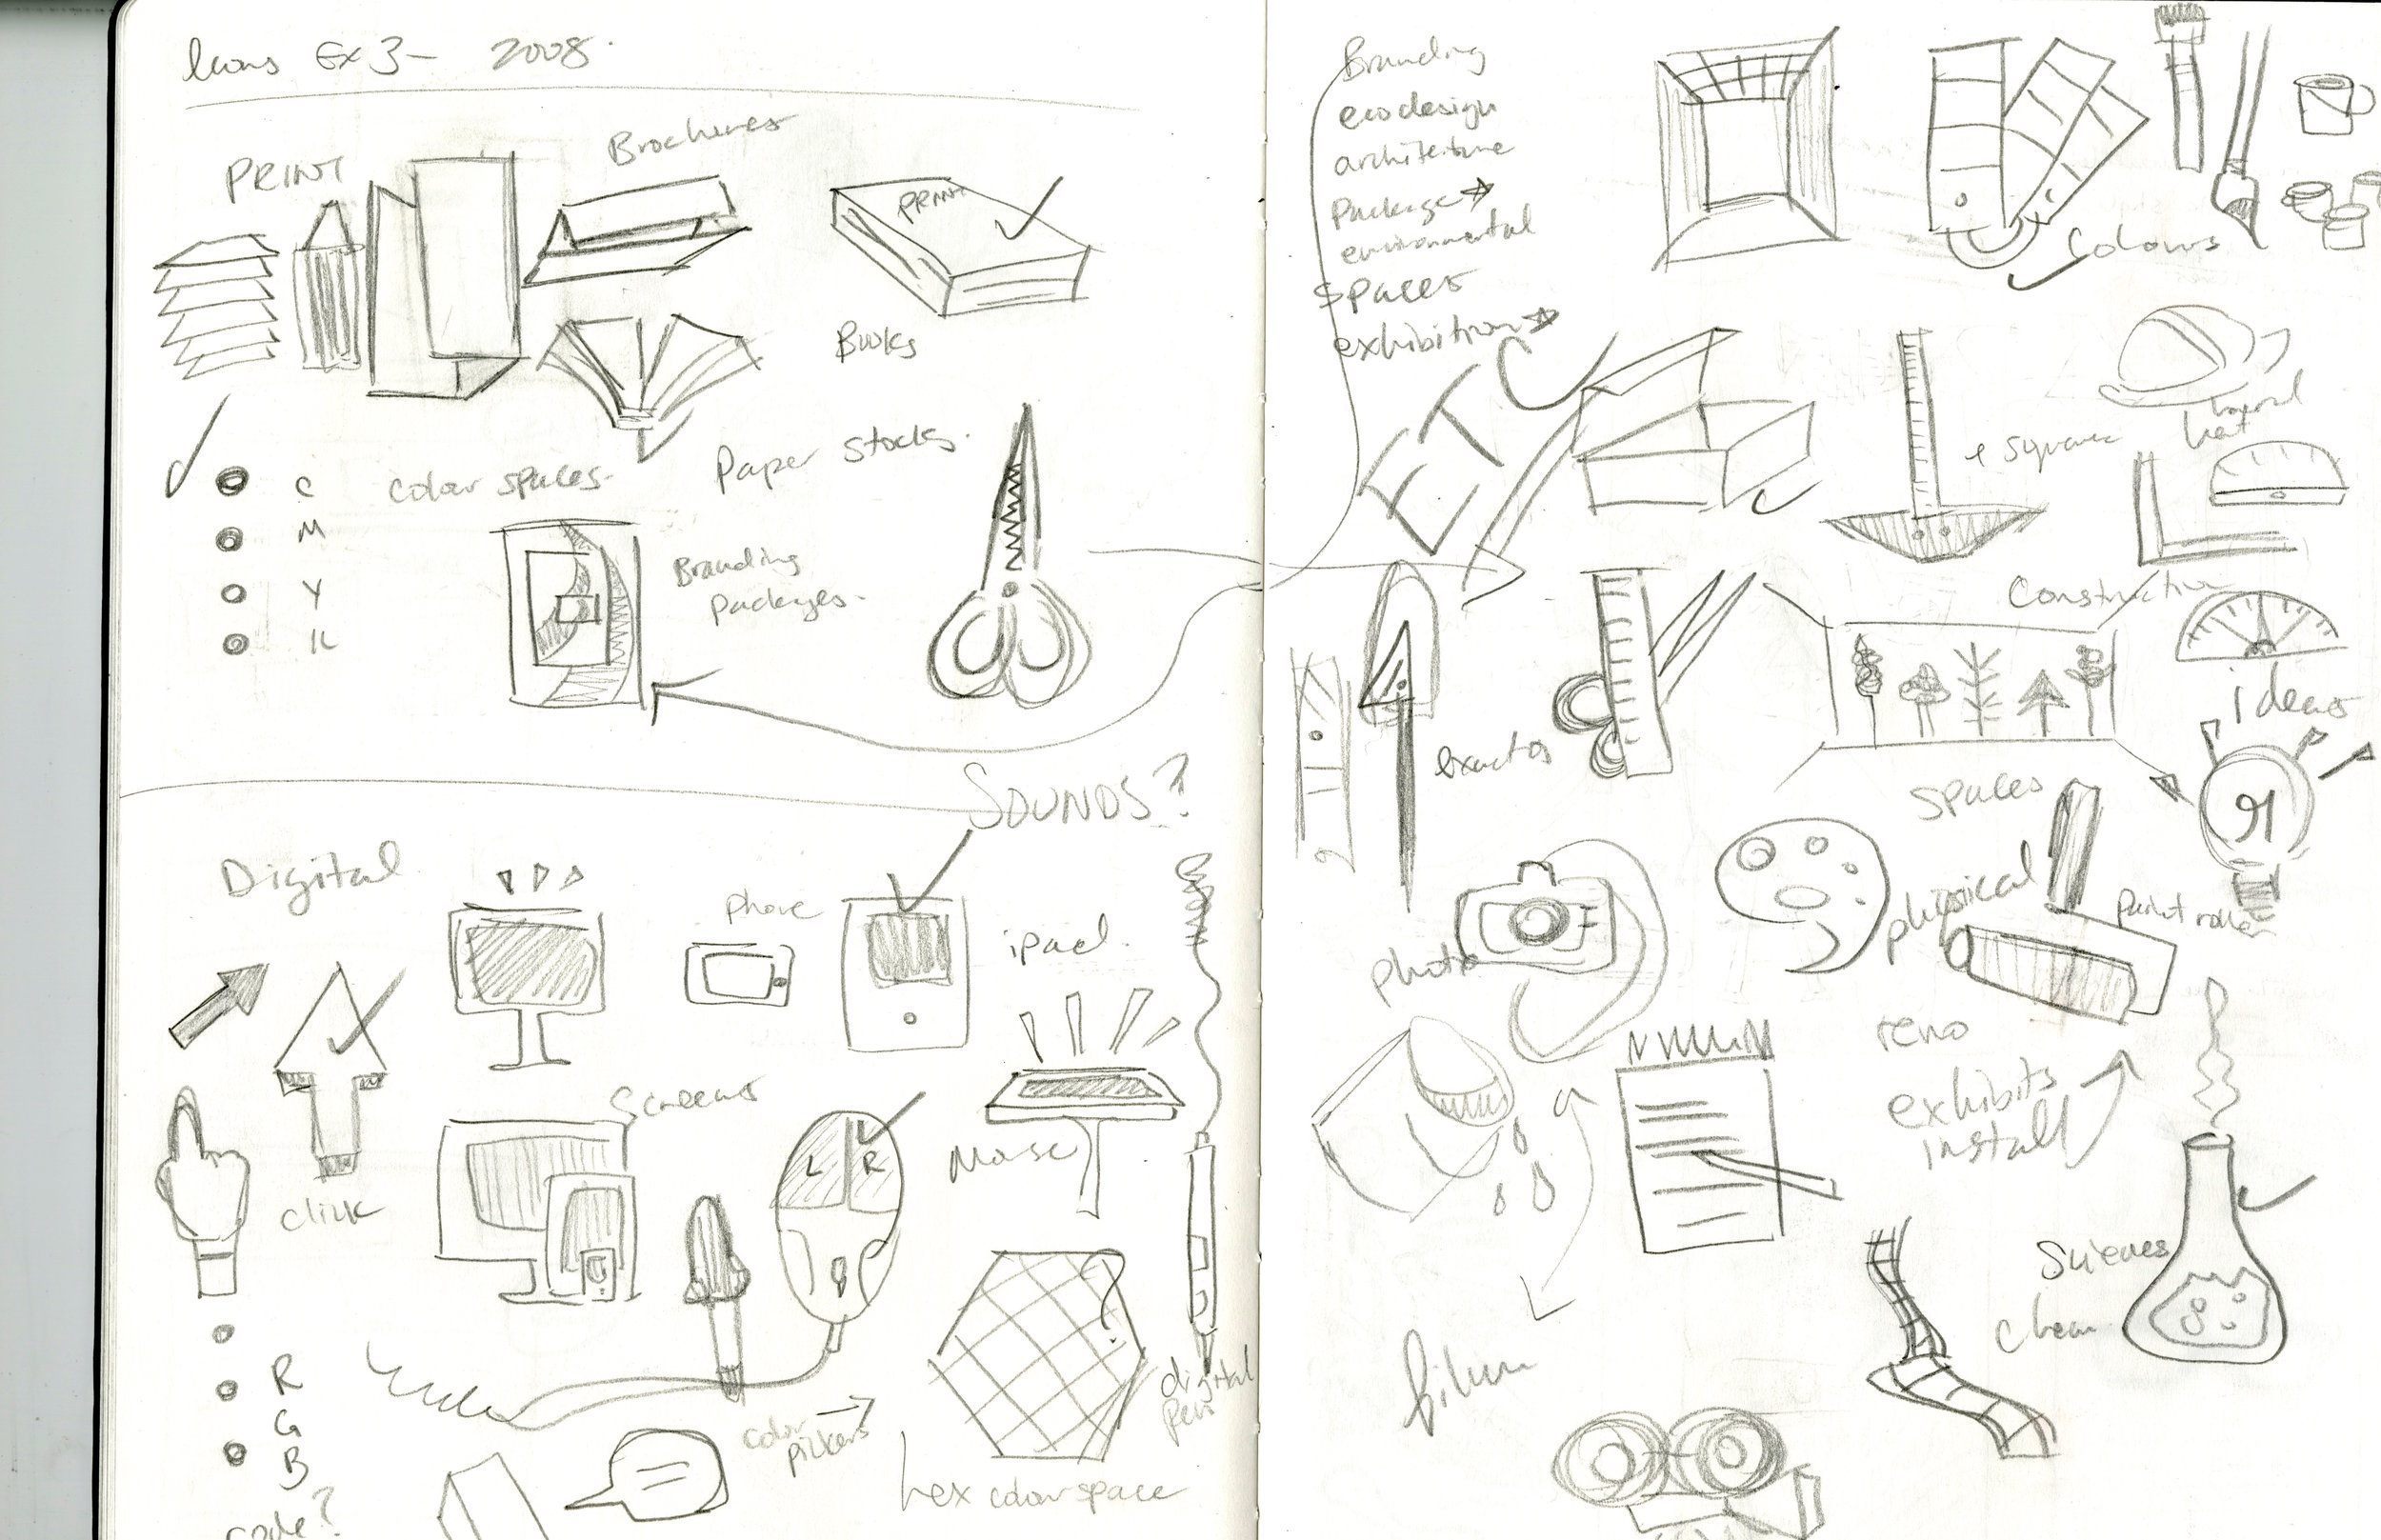
The best part of any project in my opinion is before the execution, the only time when the ideas really have no limits. I thought up of all the things I wanted to know as a student, and tried to include them into the narrative of my side scrolling city journey for a user/viewer.